February 2022
While Newton's contributions to science are omnipresent, his influence on economics is less appreciated. Adam Smith, the father of modern economics, applied Newton's law to explain the relationship between macroeconomic variables; a simple example being lower interest rates incentivize borrowing and hence increased credit growth.
Smith's application of Newton's law gets even more intriguing when two macroeconomic variables behave at odds to their expected causal relationships. This gives rise to paradoxes like those seen in the Indian economy as we recover from the pandemic: increased liquidity but muted credit growth, depressed economic activity but buoyed investor sentiments, increased inflation but subdued GDP growth, and so on.
India's recovery seems to be a story of both boom and bust. Despite the inevitable loss of income arising from business failures and unemployment, 2021 was the IPO market's best year in history.
Many a time, we sympathize with Erwin Shrödinger's dilemma as he tried to reconcile paradoxes for Albert Einstein with his timeless example of "Shrödinger's Cat". How can the cat be alive and dead at the same time? While we have no ability to let this cat out of the bag, a few simple observations do provide us with fleeting moments of lucidity.
Stock market vs. the economy: India's headline index, the Sensex, is up ~45% since ~40,000 levels in December 2019, just before the pandemic. It has significantly outperformed most markets (the DJIA is up ~27% and the FTSE is breaking even). The recent Indian bull run juxtaposed against the pandemic-affected economy has resulted in this market being billed as one of the most expensive in the world (a P/E of 26.4x), compared to the US (18.6x), China (16.5x), and the UK (17.9x) as of January 2022. India's Buffet Indicator (market cap to GDP ratio) is ~115% today, second only to the 2007 bull market peak (149%).
In contrast, GDP and GDP per capita have respectively dropped 7.3% and 8.2% since 2019. The obvious question: why is the stock market soaring while economic growth has not recovered and the average Indian is getting poorer?
Approximately $32.5 billion has been pumped into Indian stock markets since December 2019 by foreign and domestic institutions alike. Stable economic policies, a slew of fiscal initiatives (Goods and Services Tax "GST" & Production Linked Incentive "PLI" Schemes), our half-a-billion strong labor force available at competitive wage rates, and abundant natural resources have resulted in India increasingly being considered the new haven for multinational companies seeking to reduce their dependence on China. As interest rates declined, investors also turned to the stock market for better returns. With too much money chasing a few fancied stocks, the larger companies in particular command lofty valuation multiples.
India's unorganized sector currently accounts for ~45% of GDP, disproportionately higher compared with that of the US and Europe where it is speculated to be in the single-digit percents. Considering that the unorganized sector accounts for over 85% of India's workforce, it becomes easier to understand why GDP per capita has declined even while the organized sector (mostly represented in the stock market by listed companies) is flourishing.
Indian billionaires have seen their wealth more than double since the pandemic; compounded by the number of billionaires increasing 40% to 142 individuals. The divide between the rich and the poor has widened – with the former creating exponential wealth in the stock markets while the latter struggling to retain jobs. Several government initiatives (notably GST and PLI) particularly favour the organized sector to the detriment of the informal economy.
Investment vs. Asset Creation: An uptick in investment is usually followed by asset creation. Companies raise money to increase capacities/build new factories, while investors are eager to invest in a growth story.
2021 was a mega year for IPOs. 117 Indian companies listed in 2021, raising $17.5 billion – the most ever raised through IPOs and almost double the aggregate of the prior 3 years. Fun fact – Nykaa, a beauty-products e-commerce company, listed at a whopping 1,602x P/E – a company clearly in vogue! Indian startups raised $39 billion last year, nearly 3x the previous best of $14.6 billion in 2019. India now has 81 unicorns, 44 of which joined the club in 2021.
With all the money raised by startups and IPOs, asset creation should have increased. Instead, it has steadily declined from 36% of GDP in 2008 to 26% in 2020. A major factor has been that a large portion of funds raised has been used to provide exits to existing investors and founders, thereby improving VC returns (i.e., "DPI" or dollars realized per investment). Of the $17.5 billion raised in IPOs last year, a third was raised by asset-light companies where the majority of funds were spent on marketing and operational expenditures rather than asset creation. Companies have also been motivated to de-leverage balance sheets (average debt-equity ratio now at 0.7x, the lowest in 3 decades). Lofty valuations allow for cheaper equity raises, and companies have been quick to act.
Fortunately, with the government targeting $1.3 trillion in infrastructure spend over the next 5 years, and encouraging exports, a capex investment cycle is on the horizon. A recent survey of 56 of India's largest companies indicated that capacity utilization was picking up (40% were approaching 80% utilization), signalling the need for capacity expansions in the years ahead.
Liquidity vs. credit growth: Quantitative easing has led to a flux of liquidity into the economy, increasing consumption and investment. Since March 2020, the RBI has injected ~$59 billion of liquidity while maintaining the lowest interest rates in a decade (currently at 4.0%, down from 5.3% pre-pandemic).
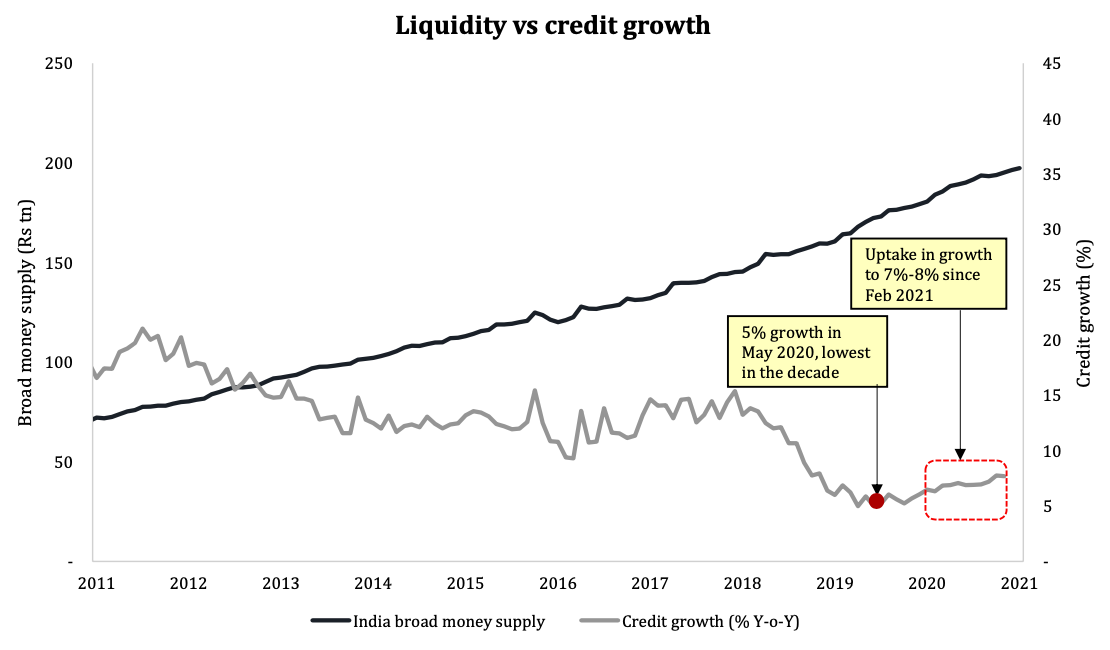
Easy access to money should typically fuel borrowings. Instead, credit growth has remained muted, averaging ~6%.
Credit growth has been slow due to reduced demand from the creditworthy. Individual investors, who held ~14.4% of the total Indian market capitalization in December 2019 (or ~$298 billion), currently hold 15.6% of a much larger market capitalization (or ~$543 billion). While there has been significant wealth creation on one end, the other end has become poorer, with average GDP per capita down 8.2%.
These circumstances also extend to the business side. Creditworthy companies are reducing debt and are sitting on more cash than before: the average current account savings account ("CASA") deposits across Indian banks increased by 17.6% in 2021 from $592 billion to $908 billion (compared to a 9% average over the prior five years).
Unfortunately, the lower income class (68.8% of India's population lives on less than $2 a day) and small businesses (63 million in number) are mostly outside traditional banking channels and face the uphill battle of rising input costs and reducing sales with minimal or no access to credit.
One is reminded of the paradox that occurred when Great Britain went through the Industrial Revolution, widely heralded as the most important milestone in the history of economics. Some naysayers objected that while the growth of the economy's overall productive powers was unprecedented, living standards for the majority of the population did not grow meaningfully until the late 19th and 20th centuries and that in many ways workers' living standards declined under early capitalism. Studies have shown that real wages in Britain only increased 15% between the 1780s and 1850s and that life expectancy in Britain did not begin to dramatically increase until the 1870s. Similarly, the average height of the population declined during the Industrial Revolution, implying that nutritional status was also decreasing. Real wages were not keeping up with the price of food.
It is said that Einstein and Shrodinger agreed that the most probable scenario was that, paradoxically, the cat was alive and dead at the same time! We seem to have the reality of simultaneous wealth creation and wealth destruction. We have GDP growth juxtaposed with GDP decline. As with the Industrial Revolution, it is possible that there is a lag effect before some of the longer-term effects become visible. As the organized sector increases its share of the economy (thereby including a larger segment of the workforce), we expect to see harmony in the system, allowing economists and capitalists to concur on the longer-term effects of a reforming economy. While we cannot be sure of the cat, we do believe that India (often symbolized as a lumbering elephant) is alive and well.